


.jpg)
-
1 Pit-Lane Visit
41.7%
95 of 228 Grands Prix -
2 Pit-Lane Visits
40.4%
92 of 228 Grands Prix -
1 or 2 Visits Combined
82.0%
187 of 228 Grands Prix -
3+ Timing-Loop Visits
17.5%
40 of 228 (Includes SC Bypasses)
Modern Formula 1 strategy is frequently framed as an open-ended tactical contest, yet historical race records reveal a tightly bounded reality: Grand Prix winners almost universally record either one or two pit-lane visits. However, official databases capture physical transponder timing-loop transits rather than tactical tyre services, meaning published counts reflect operational neutralizations alongside strategic pit stops.
Across all 228 World Championship Grands Prix contested during Formula 1’s turbo-hybrid era from 2014 through 2024, classified race winners completed one or two pit-lane visits in 187 events. This represents 82.02% of all victories in the 11-season sample. Single-visit outcomes account for 95 wins (41.67%), while two-visit outcomes claimed 92 wins (40.35%). Races recording three or more pit-lane visits produced 40 victories (17.54%), though many of these higher tallies reflect operational neutralizations rather than aggressive multi-stop tyre strategies, while exactly one race concluded with zero recorded transponder visits (0.44%).
This concentration around one and two visits stems partly from the physical cost of pit entry under green-flag racing. Pitting during uninterrupted running imposes a net time loss of 20 to 25 seconds depending on circuit geometry and pit-lane speed limits. As demonstrated in break-even modeling on when an extra pit stop is worth the time loss, an extra stop requires lapping substantially faster on fresher rubber to repay that deficit. Leading cars manage degradation from the front, turning potential two-stop races into controlled one-stop drives as outlined in how to read tyre strategy. Crucially, this penalty model does not govern race neutralizations. Under Sporting Regulations Article 57, red-flag race suspensions allow teams to change tyres in the pit lane with zero green-flag time loss. Consequently, official records classify events like Monaco 2024 (Charles Leclerc) and São Paulo 2024 (Max Verstappen) as one-stop wins, and Brazil 2016 (Lewis Hamilton) as a two-stop win, even though none of those winners made an on-track green-flag tyre stop.
Descriptively, winning visit distributions shifted across regulatory sub-eras. During the 2014–2021 turbo-hybrid era (N = 160), one-visit wins led at 43.12% (69 wins) over two visits at 40.00% (64 wins). Under ground-effect regulations from 2022 to 2024 (N = 68), two-visit outcomes narrowly surpassed single visits at 41.18% (28 wins) versus 38.24% (26 wins), while three-or-more-visit events rose from 16.25% to 20.59% (14 wins). This shift is observational; it reflects evolving Pirelli tyre compound allocations, track resurfacing, and tactical responses rather than proven aerodynamic causation.
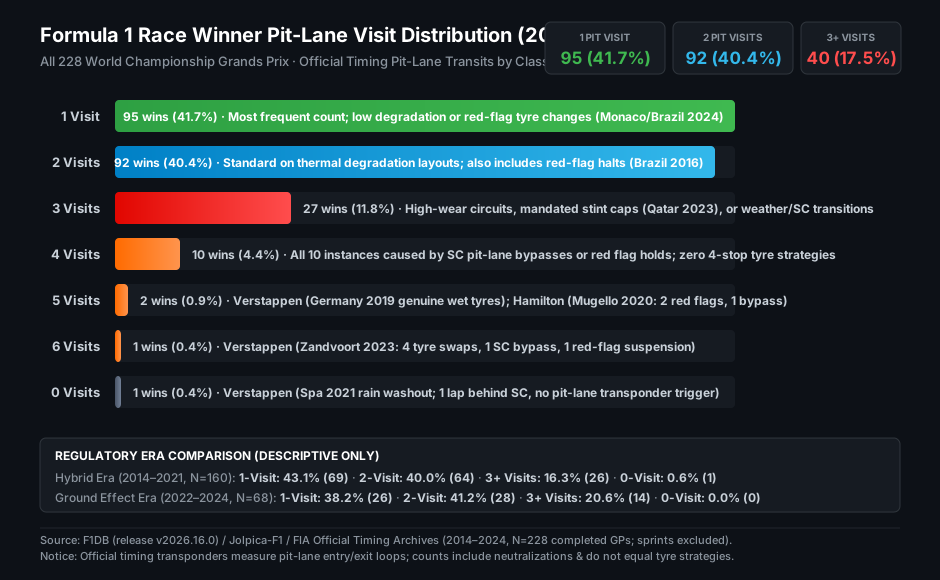
Official timing transponders measure pit-entry and pit-exit loops rather than stationary tyre servicing, as detailed in what fastest pit stop records measure. High stop counts (four to six) typically record race neutralizations rather than tactical multi-stop tyre strategies. All 10 four-stop victories in 2014–2024 were driven by Safety Car pit-lane bypasses or red flags; not a single turbo-hybrid Grand Prix was won on a genuine four-stop tyre strategy. When Race Control routes the field through the pit lane at the speed limit to clear main-straight debris—such as Hamilton’s three opening-lap bypasses at Singapore 2017 or similar transits in China 2017 and Hungary 2015—every transit logs an official pit stop without tyre service.
The solitary zero-visit winner occurred at the rain-curtailed 2021 Belgian Grand Prix at Spa-Francorchamps (the one-lap, red-flagged wash-out officially recorded in 2021, often cited alongside 2020 pandemic-era disruptions), where Max Verstappen completed one official lap behind the Safety Car before Race Control terminated the event. Because cars never entered the pit lane under race conditions, Verstappen received zero recorded timing-loop visits. In contrast, 2020 Spa ran the full 44-lap distance with a standard single pit stop. Conversely, the authentic benchmark for serviced stops belongs to Verstappen at Germany in 2019, where five genuine tyre changes mastered treacherous wet weather.
Crucially, sample counts do not equal winning probabilities. Recording one or two visits does not cause victory; dominant cars qualify at the front, dictate stint lengths, and control pace, granting the tactical leeway to exploit undercut and overcut opportunities. Trailing teams adopting identical pit counts face dirty air, tyre degradation, and traffic that erode theoretical strategic parity across a full Grand Prix distance.
| Visits | Wins (N=228) | Share (%) | Hybrid 2014–21 (N=160) | Ground Effect 2022–24 (N=68) | Operational & Tactical Context |
|---|---|---|---|---|---|
| 0 | 1 | 0.44% | 1 (0.62%) | 0 (0.00%) | Rain suspension; 1 lap behind SC, no loop transit (Spa 2021) |
| 1 | 95 | 41.67% | 69 (43.12%) | 26 (38.24%) | Low degradation or red-flag suspension tyre changes (Monaco/Brazil 2024) |
| 2 | 92 | 40.35% | 64 (40.00%) | 28 (41.18%) | Thermal degradation; also includes red-flag stoppages (Brazil 2016) |
| 3 | 27 | 11.84% | 17 (10.62%) | 10 (14.71%) | High wear; mandated stint caps (Qatar 2023) or mixed weather |
| 4 | 10 | 4.39% | 7 (4.38%) | 3 (4.41%) | Safety Car pit-lane bypasses or red flags; zero 4-stop tyre strategies |
| 5 | 2 | 0.88% | 2 (1.25%) | 0 (0.00%) | Rain swaps (Germany 2019) or red flags (Mugello 2020) |
| 6 | 1 | 0.44% | 0 (0.00%) | 1 (1.47%) | Mixed weather switches plus red flag (Zandvoort 2023) |
| Sum | 228 | 100.00% | 160 (100.00%) | 68 (100.00%) | Complete 11-season turbo-hybrid audit |