


.jpg)
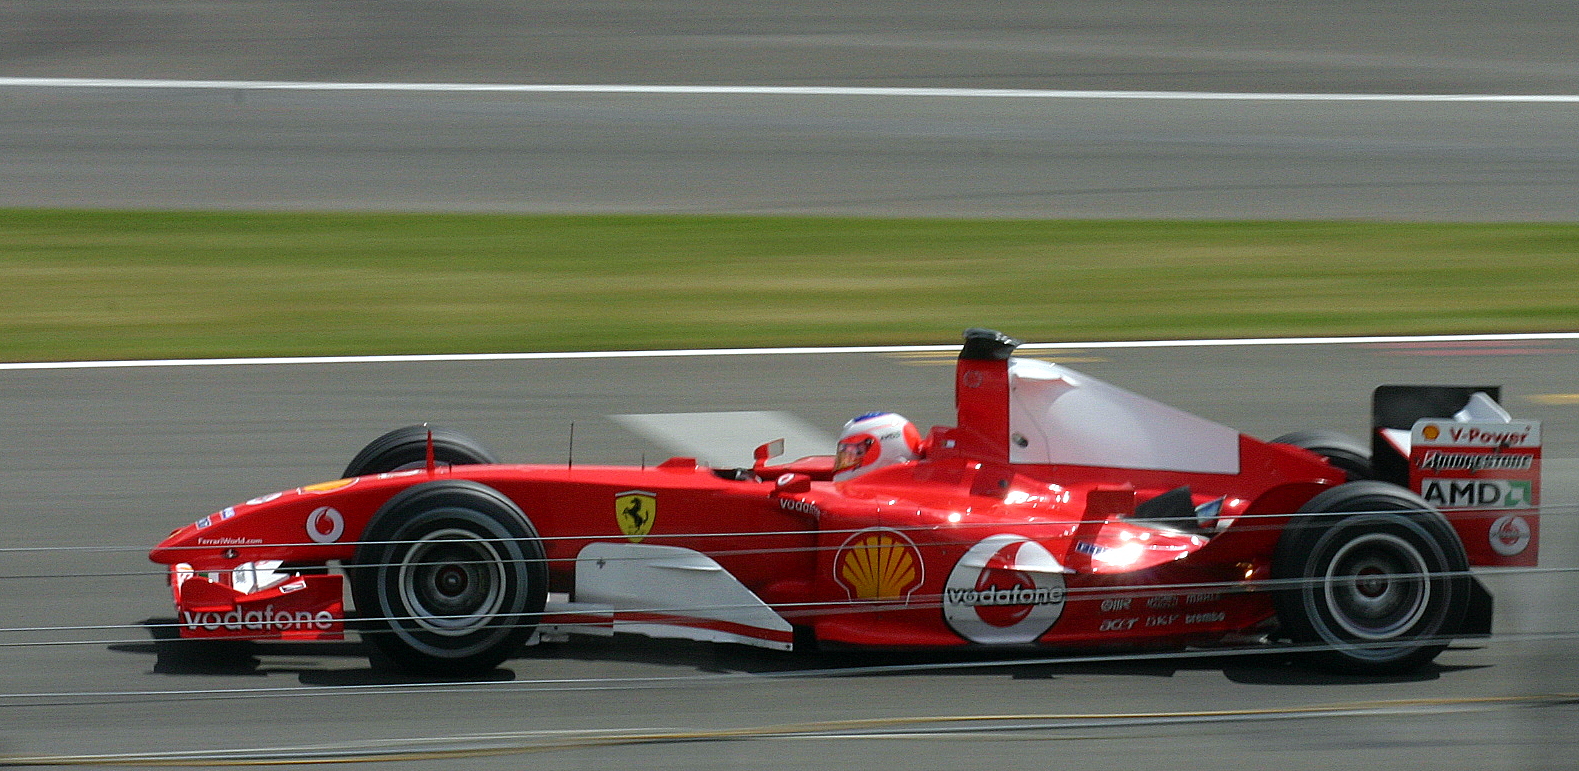
Photograph: Martin Lee.
Original source
Wikimedia Commons file
CC BY-SA 2.0
Unmodified original source image binary staged without crop.
-
1984 Classification Share
40.0%
166 of 415 starters -
2024 Classification Share
90.5%
431 of 476 starters -
40-Year Trajectory
+50.5 pp
Shift from minority to majority -
2024 100% Classification Races
4
Bahrain, Spain, Austria, Netherlands
Defining the classification threshold and starter denominator
In Formula 1 statistical records, Sunday entries divide into two groups: cars achieving official classified ranking, and cars that do not. Across five benchmark seasons spaced at ten-year intervals—1984, 1994, 2004, 2014, and 2024—the share of starters achieving official classified status shifted from a minority outcome into an overwhelming majority.
To measure this progression reproducibly, starters and classified entries are defined strictly by race results from the frozen F1DB archive (release 2026.15.1), verified against official FIA classifications. A car is recorded as a starter if it took the start from the grid or pit lane: classified cars, retirements (DNF), unclassified runners (NC), and post-race disqualifications (DSQ). Non-starters (DNS, DNQ, pre-race exclusions, and sprints) are excluded from the denominator.
The official classification rate follows a defined mathematical formula: the count of officially classified cars divided by total starters, expressed as a percentage:
$$\text{Official Classification Rate (\%)} = \left(\frac{C}{S}\right) \times 100 = \left(\frac{\text{Officially Classified Entries}}{\text{Starters}}\right) \times 100$$
Under governing sporting regulations, official classification requires covering at least 90 percent of the winner’s distance, rounded down to the nearest whole lap. Crucially, cars classified under this 90 percent threshold may have retired laps before the chequered flag without physically reaching it. For instance, a car retiring on lap 55 of a 60-lap race achieves 91.7 percent distance and is officially classified in final results despite not crossing the line.
Benchmark seasons: 1984 through 2024
In 1984, across 16 Grands Prix, only 166 of 415 starters achieved official classification (40.0 percent). Fourteen rounds saw under half the field classified, bottoming out at Detroit (5 of 26 starters, 19.2 percent). Database records list 26 disqualifications, all belonging to Tyrrell. These reflect the FISA Court of Appeal retroactively expunging Tyrrell’s championship record after Detroit, rather than 26 separate Sunday stewards rulings. Excluding Tyrrell’s 26 expunged starts from the denominator yields an official classification rate of 42.7 percent (166 of 389). Points dynamics from this era are explored in our study of scoring systems and title margins.
In 1994, the official classification rate rose to 49.6 percent (205 classified cars from 413 starters across 16 rounds). Half the season’s races saw fewer than 50 percent of starters classified, with Germany recording a low of 8 classified cars from 26 starters (30.8 percent).
The 2004 season marked a major transition. Across 18 Grands Prix, 261 of 360 starters earned classified status (72.5 percent). Nine rounds saw at least 80 percent of starters classified, while only Indianapolis (9 of 20, 45.0 percent) fell below half. This era was examined in our study of Schumacher’s 2002 and 2004 Ferrari seasons.
By 2014, the official classification share reached 80.9 percent (327 classified cars from 404 starters across 19 rounds). Twelve rounds recorded classification rates of at least 80 percent, with Australia marking the season low at 59.1 percent (13 of 22 starters).
The 2024 season established unprecedented classification levels. Across 24 Grands Prix, 431 of 476 starters earned official classification (90.5 percent). Twenty-two rounds (91.7 percent) achieved classification rates of 80 percent or higher. Four Grands Prix—Bahrain, Spain, Austria, and the Netherlands—saw all 20 starters achieve official classified status (100.0 percent). The lowest rounds, Canada and Qatar (15 of 20, 75.0 percent), exceeded full-season averages from 1984, 1994, and 2004.
Official Classification Summary Across Five Benchmark Seasons (1984–2024)
| Season | Grands Prix | Total Starters ($S$) | Classified ($C$) | Classification Share | DNF | NC | DSQ | Excluded (DNS/DNQ/EX) |
|---|---|---|---|---|---|---|---|---|
| 1984 | 16 | 415 (389*) | 166 | 40.0% (42.7%*) | 218 | 5 | 26 | 19 (7 DNS, 11 DNQ, 1 EX) |
| 1994 | 16 | 413 | 205 | 49.6% | 204 | 0 | 4 | 31 (3 DNS, 28 DNQ) |
| 2004 | 18 | 360 | 261 | 72.5% | 93 | 1 | 5 | 0 |
| 2014 | 19 | 404 | 327 | 80.9% | 75 | 1 | 1 | 3 (3 DNS) |
| 2024 | 24 | 476 | 431 | 90.5% | 43 | 0 | 2 | 3 (3 DNS) |
| Total | 93 | 2,068 (2,042*) | 1,390 | 67.2% (68.1%*) | 633 | 7 | 38 | 56 (16 DNS, 39 DNQ, 1 EX) |
Note: Starters (S) include all cars taking the start (S = C + DNF + NC + DSQ). The 1984 sensitivity figures in parentheses exclude the 26 Tyrrell event entries expunged by the FISA Court of Appeal.
Event-to-event classification rate distribution across 93 Grands Prix
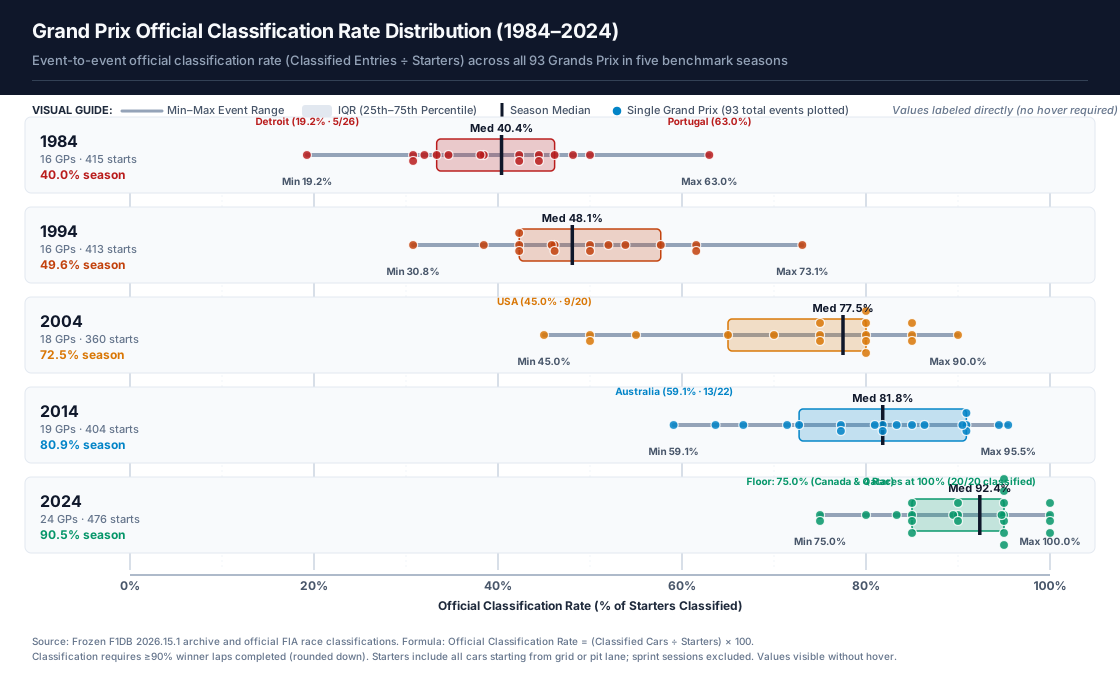
Evaluating event-to-event distributions across all 93 Grands Prix demonstrates why full-season averages alone can be misleading. In 1984, classification rates ranged widely from 19.2 percent to 63.0 percent (median 40.4 percent). By 2024, rates compressed tightly between 75.0 percent and 100.0 percent (median 92.4 percent), with modern floors exceeding historic ceilings.
| Season | Round | Grand Prix Name | Circuit | Starters ($S$) | Classified ($C$) | Official Classification Rate |
|---|---|---|---|---|---|---|
| 1984 | R01 | Grande Prêmio do Brasil 1984 | jacarepagua |
26 | 8 | 30.8% |
| 1984 | R02 | National Panasonic South African Grand Prix 1984 | kyalami |
26 | 12 | 46.2% |
| 1984 | R03 | 1984 Belgian Grand Prix | zolder |
26 | 10 | 38.5% |
| 1984 | R04 | Gran Premio di San Marino 1984 | imola |
26 | 9 | 34.6% |
| 1984 | R05 | Grand Prix de France 1984 | dijon |
26 | 13 | 50.0% |
| 1984 | R06 | Grand Prix de Monaco 1984 | monaco |
21 | 8 | 38.1% |
| 1984 | R07 | Grand Prix Labatt du Canada 1984 | montreal |
26 | 11 | 42.3% |
| 1984 | R08 | 1984 Detroit Grand Prix | detroit |
26 | 5 | 19.2% |
| 1984 | R09 | 1984 Dallas Grand Prix | dallas |
26 | 8 | 30.8% |
| 1984 | R10 | 1984 John Player British Grand Prix | brands-hatch |
27 | 12 | 44.4% |
| 1984 | R11 | Grosser Preis von Deutschland 1984 | hockenheimring |
27 | 9 | 33.3% |
| 1984 | R12 | Grosser Preis von Österreich 1984 | spielberg |
27 | 12 | 44.4% |
| 1984 | R13 | Grote Prijs van Nederland 1984 | zandvoort |
27 | 13 | 48.1% |
| 1984 | R14 | Gran Premio d’Italia 1984 | monza |
25 | 8 | 32.0% |
| 1984 | R15 | Grosser Preis von Europa 1984 | nurburgring |
26 | 11 | 42.3% |
| 1984 | R16 | Grande Prémio de Portugal 1984 | estoril |
27 | 17 | 63.0% |
| 1994 | R01 | Grande Prêmio do Brasil 1994 | interlagos |
26 | 12 | 46.2% |
| 1994 | R02 | 1994 Pacific Grand Prix | aida |
26 | 11 | 42.3% |
| 1994 | R03 | Gran Premio di San Marino 1994 | imola |
25 | 13 | 52.0% |
| 1994 | R04 | Grand Prix de Monaco 1994 | monaco |
24 | 11 | 45.8% |
| 1994 | R05 | Gran Premio Marlboro de España 1994 | catalunya |
26 | 11 | 42.3% |
| 1994 | R06 | Grand Prix Molson du Canada 1994 | montreal |
26 | 15 | 57.7% |
| 1994 | R07 | Grand Prix de France 1994 | magny-cours |
26 | 11 | 42.3% |
| 1994 | R08 | 1994 RAC British Grand Prix | silverstone |
26 | 16 | 61.5% |
| 1994 | R09 | Grosser Mobil 1 Preis von Deutschland 1994 | hockenheimring |
26 | 8 | 30.8% |
| 1994 | R10 | Marlboro Magyar Nagydíj 1994 | hungaroring |
26 | 14 | 53.8% |
| 1994 | R11 | 1994 Belgian Grand Prix | spa-francorchamps |
26 | 13 | 50.0% |
| 1994 | R12 | Pioneer Gran Premio d’Italia 1994 | monza |
26 | 10 | 38.5% |
| 1994 | R13 | Grande Prémio de Portugal 1994 | estoril |
26 | 16 | 61.5% |
| 1994 | R14 | 1994 Grand Prix of Europe | jerez |
26 | 19 | 73.1% |
| 1994 | R15 | 1994 Fuji Television Japanese Grand Prix | suzuka |
26 | 13 | 50.0% |
| 1994 | R16 | 1994 Adelaide Australian Grand Prix | adelaide |
26 | 12 | 46.2% |
| 2004 | R01 | 2004 Foster’s Australian Grand Prix | melbourne |
20 | 14 | 70.0% |
| 2004 | R02 | 2004 Petronas Malaysian Grand Prix | sepang |
20 | 16 | 80.0% |
| 2004 | R03 | 2004 Gulf Air Bahrain Grand Prix | bahrain |
20 | 17 | 85.0% |
| 2004 | R04 | Gran Premio Foster’s di San Marino 2004 | imola |
20 | 16 | 80.0% |
| 2004 | R05 | Formula 1 Gran Premio Marlboro de España 2004 | catalunya |
20 | 13 | 65.0% |
| 2004 | R06 | Formula 1 Grand Prix de Monaco 2004 | monaco |
20 | 10 | 50.0% |
| 2004 | R07 | 2004 Formula 1 Allianz Grand Prix of Europe | nurburgring |
20 | 15 | 75.0% |
| 2004 | R08 | Formula 1 Grand Prix du Canada 2004 | montreal |
20 | 10 | 50.0% |
| 2004 | R09 | 2004 Formula 1 United States Grand Prix | indianapolis |
20 | 9 | 45.0% |
| 2004 | R10 | Formula 1 Mobil 1 Grand Prix de France 2004 | magny-cours |
20 | 18 | 90.0% |
| 2004 | R11 | 2004 Formula 1 Foster’s British Grand Prix | silverstone |
20 | 16 | 80.0% |
| 2004 | R12 | Formula 1 Grosser Mobil 1 Preis von Deutschland 2004 | hockenheimring |
20 | 17 | 85.0% |
| 2004 | R13 | Formula 1 Marlboro Magyar Nagydíj 2004 | hungaroring |
20 | 15 | 75.0% |
| 2004 | R14 | 2004 Formula 1 Belgian Grand Prix | spa-francorchamps |
20 | 11 | 55.0% |
| 2004 | R15 | Formula 1 Gran Premio Vodafone d’Italia 2004 | monza |
20 | 15 | 75.0% |
| 2004 | R16 | 2004 Formula 1 Sinopec Chinese Grand Prix | shanghai |
20 | 16 | 80.0% |
| 2004 | R17 | 2004 Formula 1 Fuji Television Japanese Grand Prix | suzuka |
20 | 16 | 80.0% |
| 2004 | R18 | Formula 1 Grande Prêmio do Brasil 2004 | interlagos |
20 | 17 | 85.0% |
| 2014 | R01 | 2014 Formula 1 Rolex Australian Grand Prix | melbourne |
22 | 13 | 59.1% |
| 2014 | R02 | 2014 Formula 1 Petronas Malaysia Grand Prix | sepang |
21 | 15 | 71.4% |
| 2014 | R03 | 2014 Formula 1 Gulf Air Bahrain Grand Prix | bahrain |
22 | 17 | 77.3% |
| 2014 | R04 | 2014 Formula 1 UBS Chinese Grand Prix | shanghai |
22 | 20 | 90.9% |
| 2014 | R05 | Formula 1 Gran Premio de España Pirelli 2014 | catalunya |
22 | 20 | 90.9% |
| 2014 | R06 | Formula 1 Grand Prix de Monaco 2014 | monaco |
21 | 14 | 66.7% |
| 2014 | R07 | Formula 1 Grand Prix du Canada 2014 | montreal |
22 | 14 | 63.6% |
| 2014 | R08 | Formula 1 DHL Grosser Preis Von Österreich 2014 | spielberg |
22 | 19 | 86.4% |
| 2014 | R09 | 2014 Formula 1 Santander British Grand Prix | silverstone |
22 | 17 | 77.3% |
| 2014 | R10 | Formula 1 Grosser Preis Santander von Deutschland 2014 | hockenheimring |
22 | 18 | 81.8% |
| 2014 | R11 | Formula 1 Pirelli Magyar Nagydíj 2014 | hungaroring |
22 | 16 | 72.7% |
| 2014 | R12 | 2014 Formula 1 Shell Belgian Grand Prix | spa-francorchamps |
22 | 18 | 81.8% |
| 2014 | R13 | Formula 1 Gran Premio d’Italia 2014 | monza |
22 | 20 | 90.9% |
| 2014 | R14 | 2014 Formula 1 Singapore Airlines Singapore Grand Prix | marina-bay |
21 | 17 | 81.0% |
| 2014 | R15 | 2014 Formula 1 Japanese Grand Prix | suzuka |
22 | 21 | 95.5% |
| 2014 | R16 | 2014 Formula 1 Russian Grand Prix | sochi |
21 | 19 | 90.5% |
| 2014 | R17 | 2014 Formula 1 United States Grand Prix | austin |
18 | 15 | 83.3% |
| 2014 | R18 | Formula 1 Grande Prêmio Petrobras do Brasil 2014 | interlagos |
18 | 17 | 94.4% |
| 2014 | R19 | 2014 Formula 1 Etihad Airways Abu Dhabi Grand Prix | yas-marina |
20 | 17 | 85.0% |
| 2024 | R01 | Formula 1 Gulf Air Bahrain Grand Prix 2024 | bahrain |
20 | 20 | 100.0% |
| 2024 | R02 | Formula 1 stc Saudi Arabian Grand Prix 2024 | jeddah |
20 | 18 | 90.0% |
| 2024 | R03 | Formula 1 Rolex Australian Grand Prix 2024 | melbourne |
19 | 17 | 89.5% |
| 2024 | R04 | Formula 1 MSC Cruises Japanese Grand Prix 2024 | suzuka |
20 | 17 | 85.0% |
| 2024 | R05 | Formula 1 Lenovo Chinese Grand Prix 2024 | shanghai |
20 | 17 | 85.0% |
| 2024 | R06 | Formula 1 Crypto.com Miami Grand Prix 2024 | miami |
20 | 19 | 95.0% |
| 2024 | R07 | Formula 1 MSC Cruises Gran Premio dell’Emilia Romagna 2024 | imola |
20 | 19 | 95.0% |
| 2024 | R08 | Formula 1 Grand Prix de Monaco 2024 | monaco |
20 | 16 | 80.0% |
| 2024 | R09 | Formula 1 Grand Prix du Canada 2024 | montreal |
20 | 15 | 75.0% |
| 2024 | R10 | Formula 1 Aramco Gran Premio de España 2024 | catalunya |
20 | 20 | 100.0% |
| 2024 | R11 | Formula 1 Qatar Airways Austrian Grand Prix 2024 | spielberg |
20 | 20 | 100.0% |
| 2024 | R12 | Formula 1 Qatar Airways British Grand Prix 2024 | silverstone |
19 | 18 | 94.7% |
| 2024 | R13 | Formula 1 Hungarian Grand Prix 2024 | hungaroring |
20 | 19 | 95.0% |
| 2024 | R14 | Formula 1 Rolex Belgian Grand Prix 2024 | spa-francorchamps |
20 | 18 | 90.0% |
| 2024 | R15 | Formula 1 Heineken Dutch Grand Prix 2024 | zandvoort |
20 | 20 | 100.0% |
| 2024 | R16 | Formula 1 Pirelli Gran Premio d’Italia 2024 | monza |
20 | 19 | 95.0% |
| 2024 | R17 | Formula 1 Qatar Airways Azerbaijan Grand Prix 2024 | baku |
20 | 19 | 95.0% |
| 2024 | R18 | Formula 1 Singapore Airlines Singapore Grand Prix 2024 | marina-bay |
20 | 19 | 95.0% |
| 2024 | R19 | Formula 1 Pirelli United States Grand Prix 2024 | austin |
20 | 19 | 95.0% |
| 2024 | R20 | Formula 1 Gran Premio de la Ciudad de México 2024 | mexico-city |
20 | 17 | 85.0% |
| 2024 | R21 | Formula 1 Lenovo Grande Prêmio de São Paulo 2024 | interlagos |
18 | 15 | 83.3% |
| 2024 | R22 | Formula 1 Heineken Silver Las Vegas Grand Prix 2024 | las-vegas |
20 | 18 | 90.0% |
| 2024 | R23 | Formula 1 Qatar Airways Qatar Grand Prix 2024 | lusail |
20 | 15 | 75.0% |
| 2024 | R24 | Formula 1 Etihad Airways Abu Dhabi Grand Prix 2024 | yas-marina |
20 | 17 | 85.0% |
Uncertainty, limitations, and methodological boundaries
Across these five benchmark seasons, the official classification share rose by 50.5 percentage points. While raw event records document this empirical transition, analytical caution is required. Just as our study on whether pole position predicts race winners evaluates finishing orders from grid slots, evaluating classification rates requires recognizing statistical caveats. The 90 percent threshold classifies cars that retired in closing laps, while starting fields shrank from 26 starters in 1984 to 20 in 2024. The observational dataset reflects recorded classification status, not technical or operational causation.